CTR Optimization Report
The CTR Optimization report finds keywords where you already rank in the top 10 but your click-through rate is below what is expected for that position. These are clicks you are leaving on the table - you have the rankings, you just need better titles and descriptions to turn impressions into visits.
Improving CTR on existing rankings is one of the fastest ways to grow organic traffic without building a single backlink or writing new content.
See it in action
What the report looks like
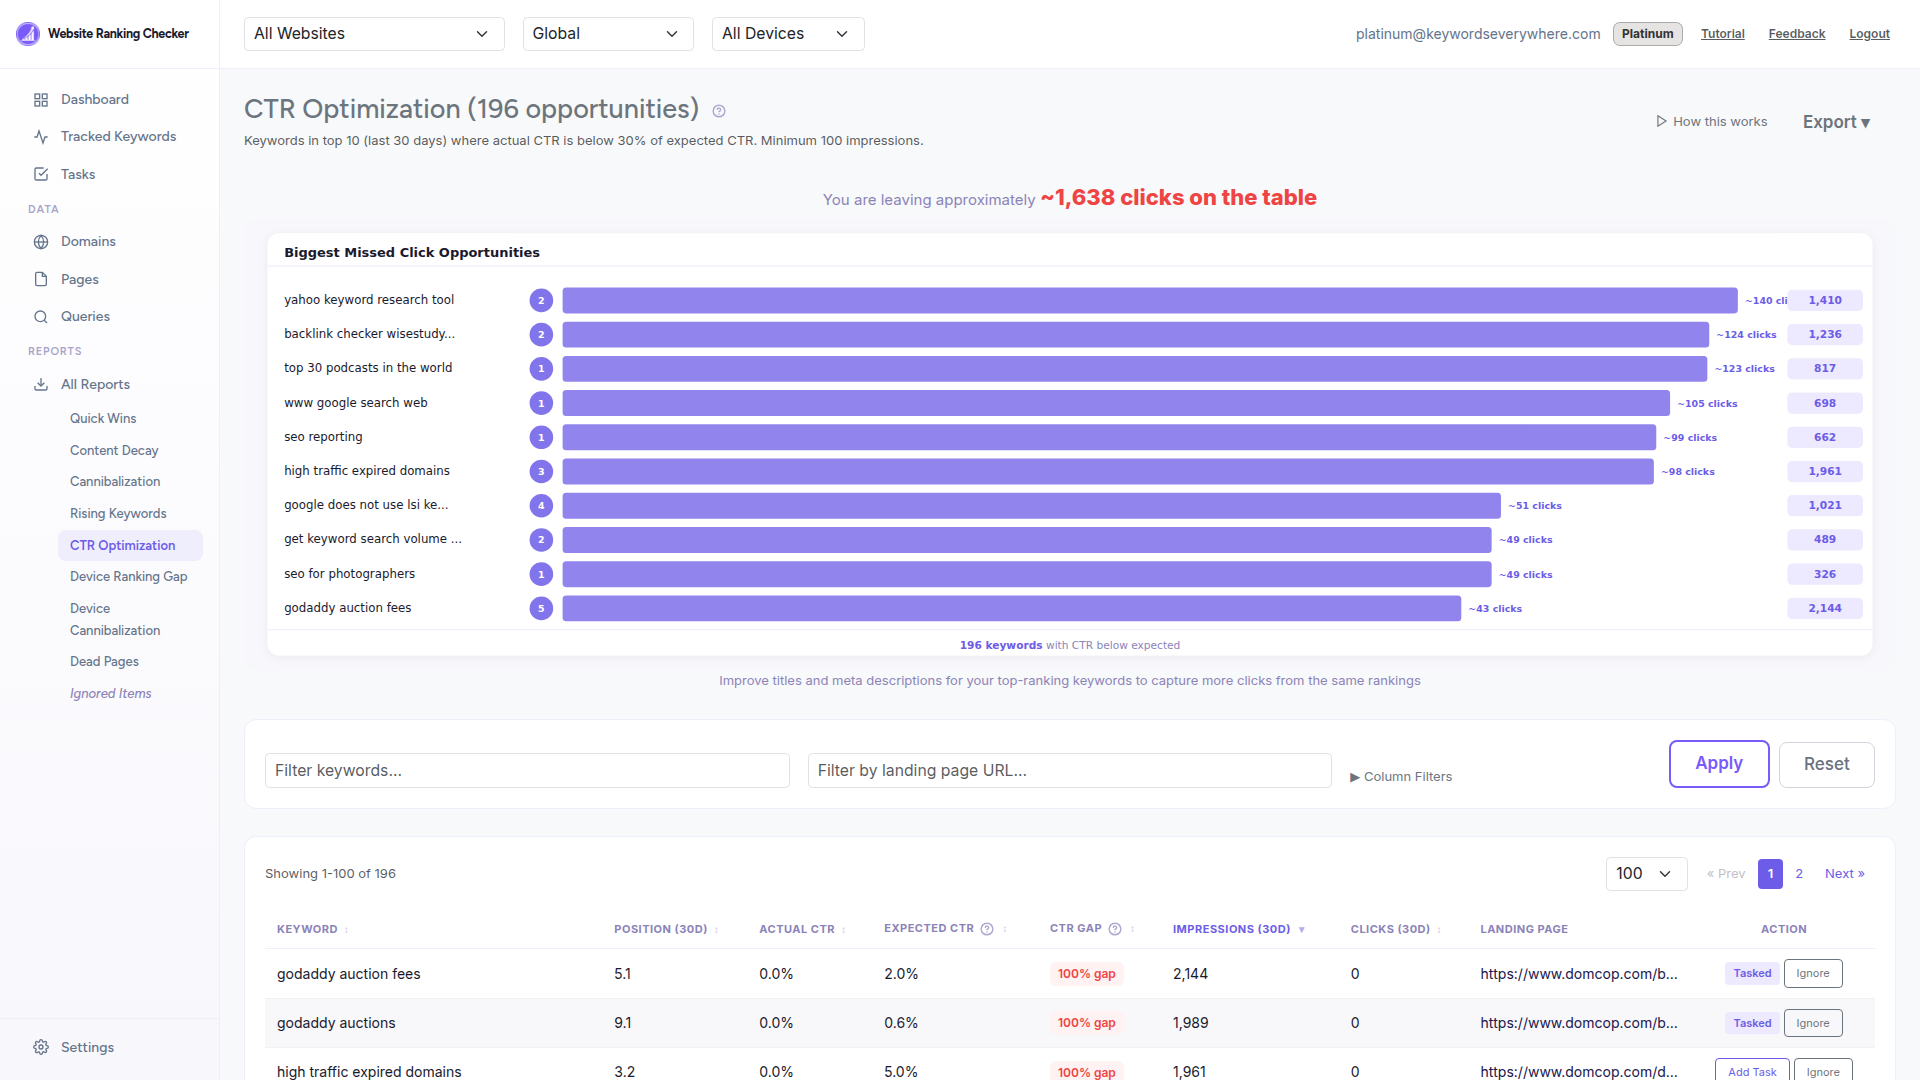
Each row shows a keyword where your actual CTR falls below what users typically click at that ranking position. The CTR gap column tells you exactly how much room for improvement exists.
What the report shows
Keyword - The search query where you are underperforming on clicks.
Position (30d) - Your impression-weighted average ranking over the last 30 days.
Actual CTR - Your real click-through rate from Google Search Console.
Expected CTR - The benchmark CTR for your ranking position, based on a 13-tier industry curve.
CTR Gap - How far below the expected CTR you are, as a percentage. Larger gaps mean more opportunity.
Impressions and Clicks (30d) - The raw traffic numbers so you can prioritize high-volume keywords.
Landing page - Which page on your site ranks for this keyword. Click to review it directly.
How to use it
Sort by CTR gap to find keywords with the most room for improvement.
Click the landing page to review the current title tag and meta description in your browser's source or an SEO tool.
Rewrite the title to be more compelling - include the keyword naturally, add a benefit or number, and keep it under 60 characters.
Update the meta description to match search intent and include a clear call to action. This is your ad copy in organic search.
Add it as a Task to track progress. The task completes automatically when your CTR reaches at least 30% of the expected rate.
How it is calculated
The report includes keywords ranked in positions 1-10 over the last 30 days with at least 100 impressions. Position is calculated as an impression-weighted average across landing pages.
Expected CTR is based on a 13-tier curve: position 1 = 25%, position 2 = 15%, position 3 = 10%, and so on down to position 50+ at 0.01%. Only keywords where actual CTR is below 30% of the expected CTR for their position are shown.
Data refreshes daily from Google Search Console and the report is cached for instant loading.
Ready to optimize your CTR?
Connect Google Search Console and find out which titles and descriptions need work. Free for all Keywords Everywhere users.