Getting Started with Website Ranking Checker
This tutorial walks you through everything Website Ranking Checker can do. Whether you just signed up or you have been using the tool for a while, this guide will help you get the most out of your data. We will start with signing up and connecting your Google Search Console, then cover each section of the app in the order that matters most.
What you need before starting: A Keywords Everywhere account (any plan, including free) and at least one website verified in Google Search Console.
1. Getting Started
Setting up Website Ranking Checker takes about five minutes. You will log in with your Keywords Everywhere API key, walk through a short setup wizard, and connect your Google Search Console. Once connected, we start importing your data automatically.
Logging in
Website Ranking Checker uses your Keywords Everywhere API key as your login credential. There is no separate username or password to remember. Head to the login page and paste your API key.
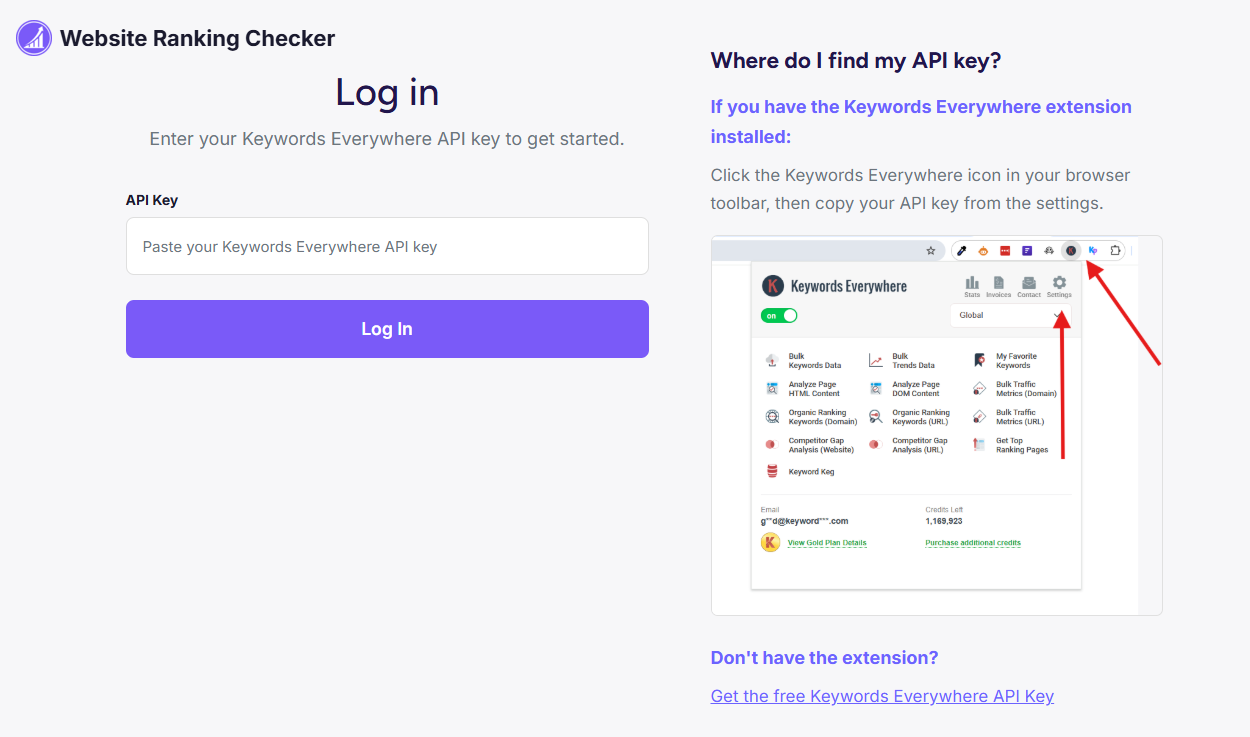
If you are not sure where to find your API key, the login page shows you exactly how. Click the Keywords Everywhere icon in your browser toolbar and you will see the key in the extension settings. You can also get a free API key at keywordseverywhere.com if you do not have the extension yet.
Setup wizard
After your first login, a short setup wizard walks you through four steps. Each step can be changed later in Settings, so don't worry about getting everything perfect right away.
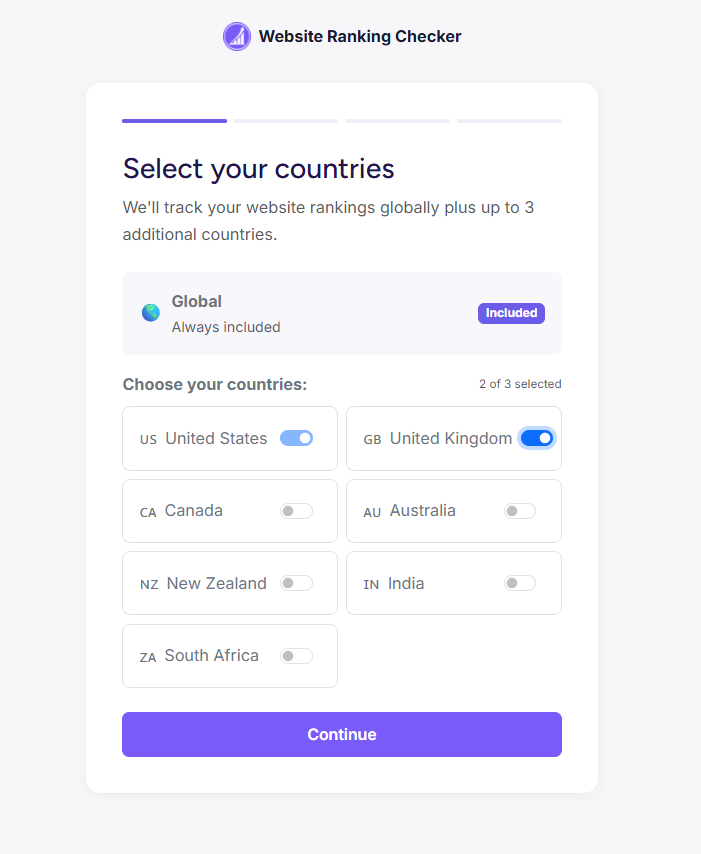
Step 1: Country selection
If you are on a paid Keywords Everywhere plan, the first step lets you select which countries you want to track separately. By default, everyone gets global data that covers all countries combined. Paid plans let you add individual countries (like USA, UK, Canada, or Australia) so you can see how your keywords perform in specific markets.
Free plan users skip this step automatically since they only have access to global data. You can always add countries later from the Settings page if you upgrade your plan.
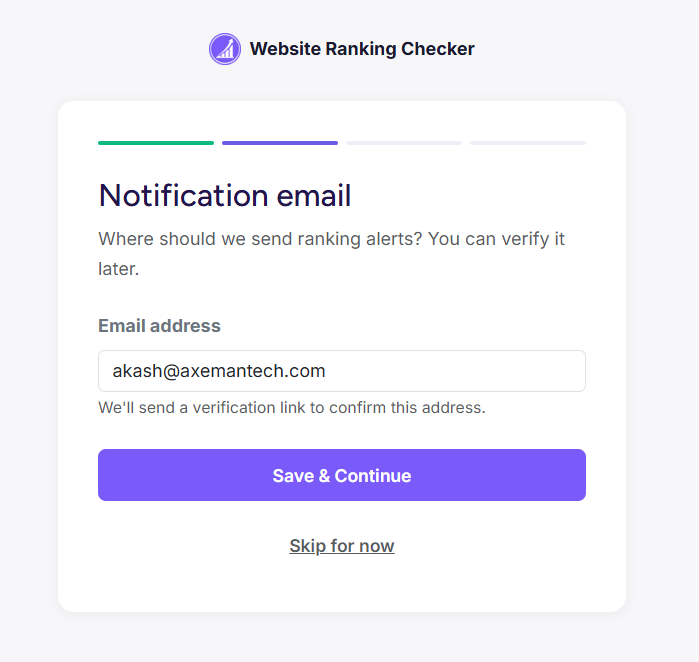
Step 2: Notification email
Enter the email address where you want to receive ranking alerts. We will send a verification link, but you can skip this step and verify later.
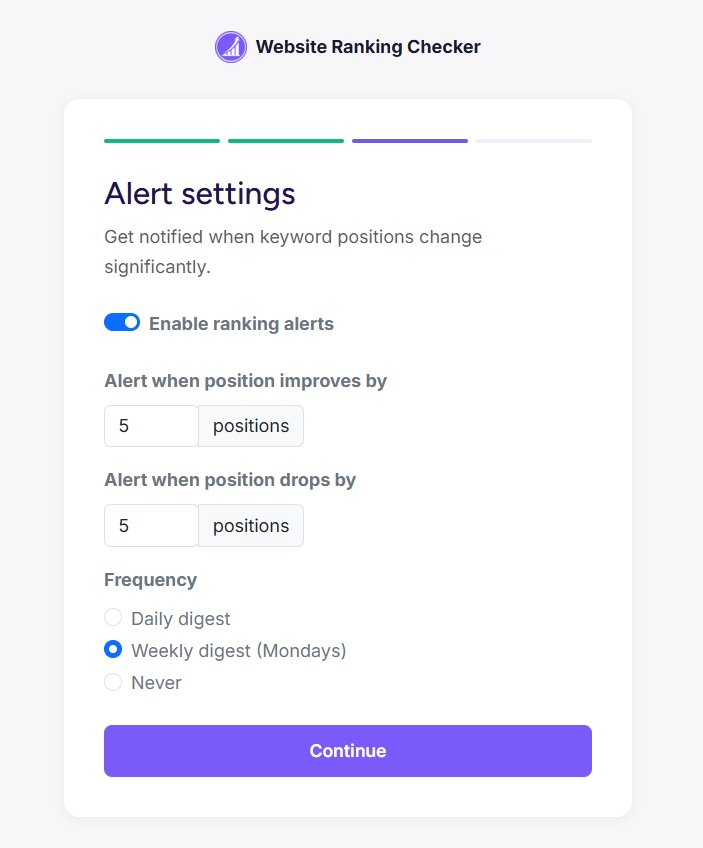
Step 3: Alert settings
Configure when and how you want to be notified about ranking changes. You can enable ranking alerts, set how many positions a keyword needs to move before you are alerted, and choose between daily digests, weekly summaries (sent on Mondays), or no alerts at all.
Step 4: Connect Google Search Console
This is the most important step. Connecting your Google Search Console is what makes everything work. We only request read-only access, so we can see your search data but cannot modify anything in your account.
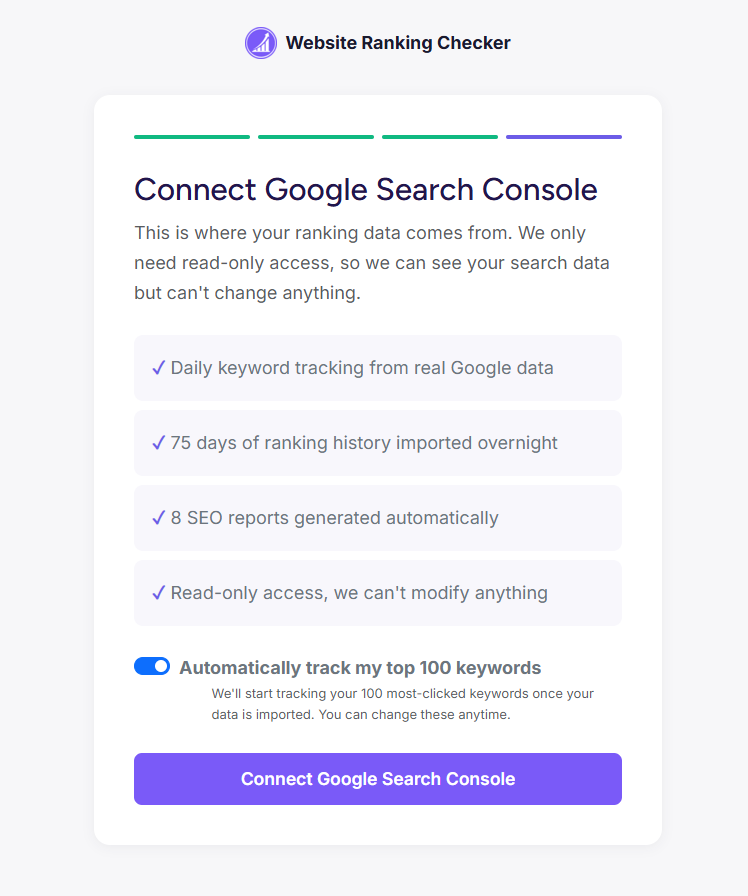
When you click "Connect Google Search Console," Google will ask you to sign in and grant permission. After you approve, we automatically import all your verified websites and start pulling in your search data.
Notice the "Automatically track my top 100 keywords" toggle at the bottom. When this is on (the default), we will start tracking your 100 most-clicked keywords as soon as the data import finishes. This gives you instant value without having to manually pick keywords.
Waiting for your data
After connecting GSC, you will see a purple banner at the top of the app telling you that data is being imported. This usually takes up to an hour depending on how much data you have. We import up to 75 days of search history, so you will have charts and trends from day one.
You will receive an email when the import is complete and your dashboard is ready. In the meantime, you can explore the app - the pages will populate as data arrives.
2. The Dashboard
The Dashboard is your daily starting point. It answers the question: "How is my search performance doing right now?" Open it each morning and you will know in seconds whether things are trending up or down.
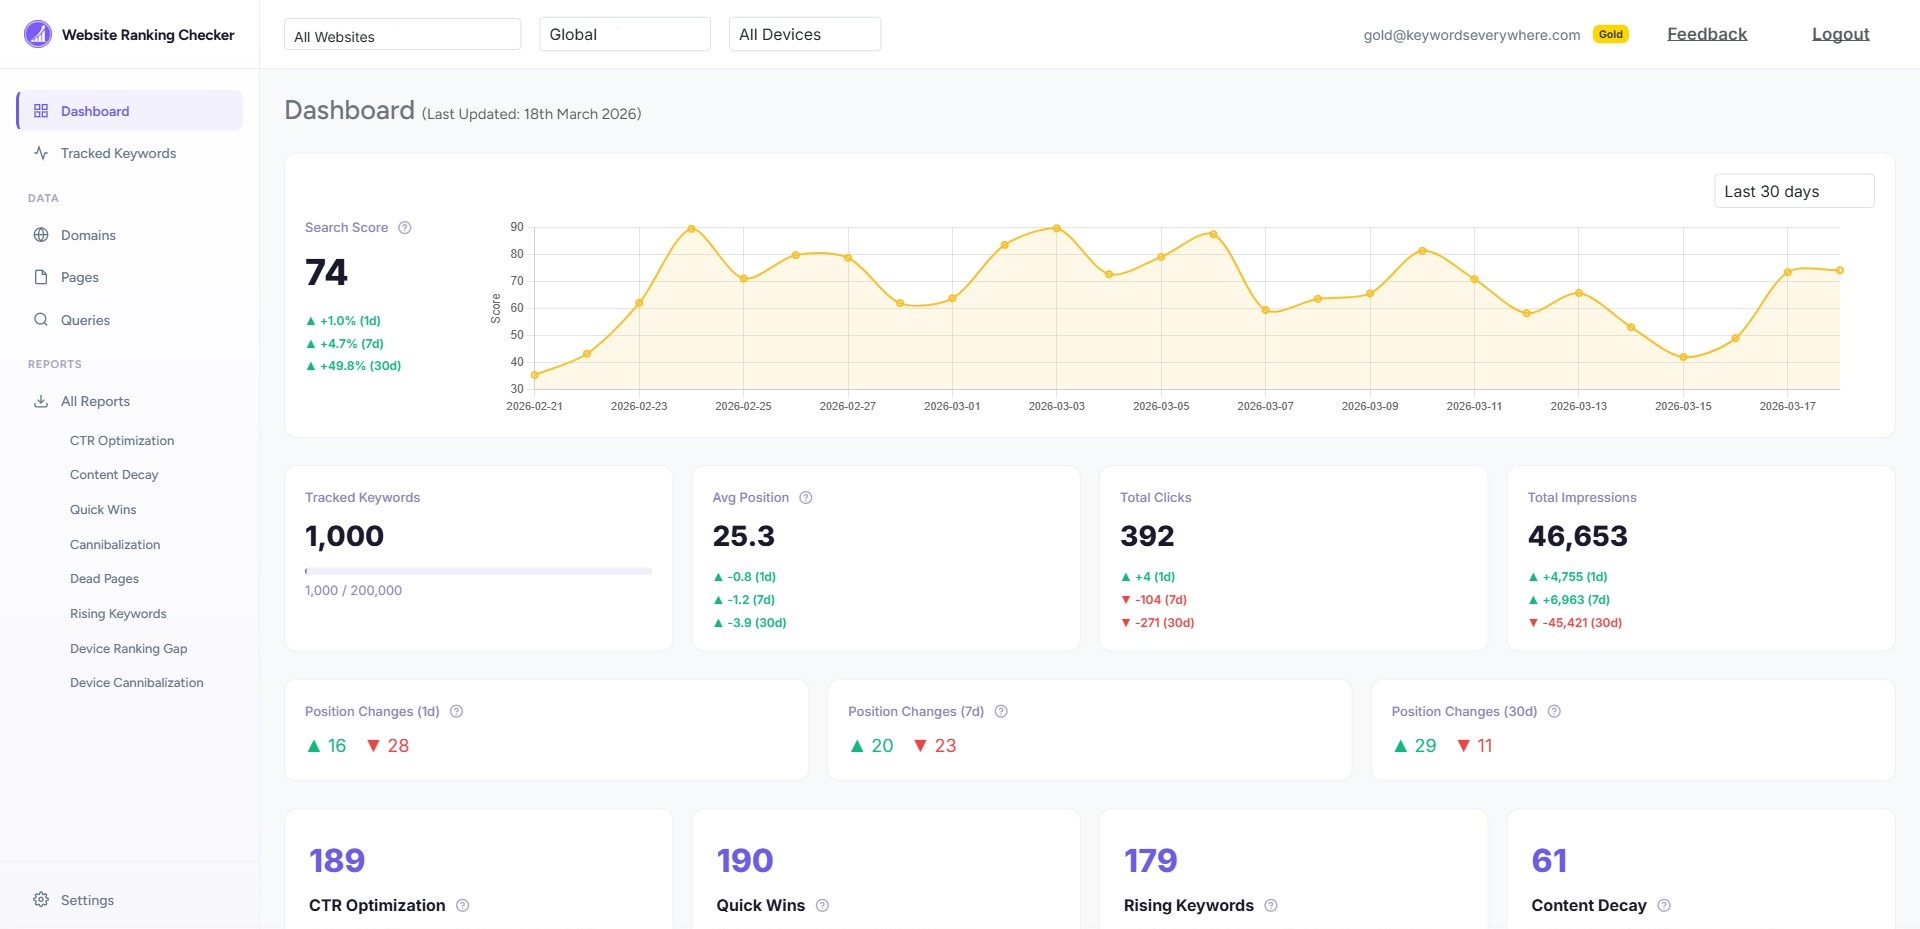
Search Score
The chart at the top shows your Search Score over the last 90 days. This is a single number that combines your keyword positions, clicks, CPC, and impressions into one trend line. When the line goes up, your overall search presence is improving. When it drops, something needs attention.
Below the chart, you will see percentage changes for 1 day, 7 days, and 30 days so you can quickly tell whether a dip is a one-day blip or a longer trend.
Stats cards
The four cards below the chart show your key numbers at a glance:
- Tracked Keywords - how many keywords you are monitoring, plus your plan limit
- Avg Position - the average ranking of your tracked keywords (lower is better)
- Total Clicks - clicks from Google search in the latest data period
- Total Impressions - how many times your pages appeared in search results
Each stat card shows changes over 1 day, 7 days, and 30 days. Green arrows pointing up mean improvement. Red arrows pointing down mean a decline.
Position Changes
The Position Changes cards show how many of your tracked keywords improved or dropped in ranking. This gives you a quick feel for whether rankings are broadly stable or shifting.
Report widgets and movers
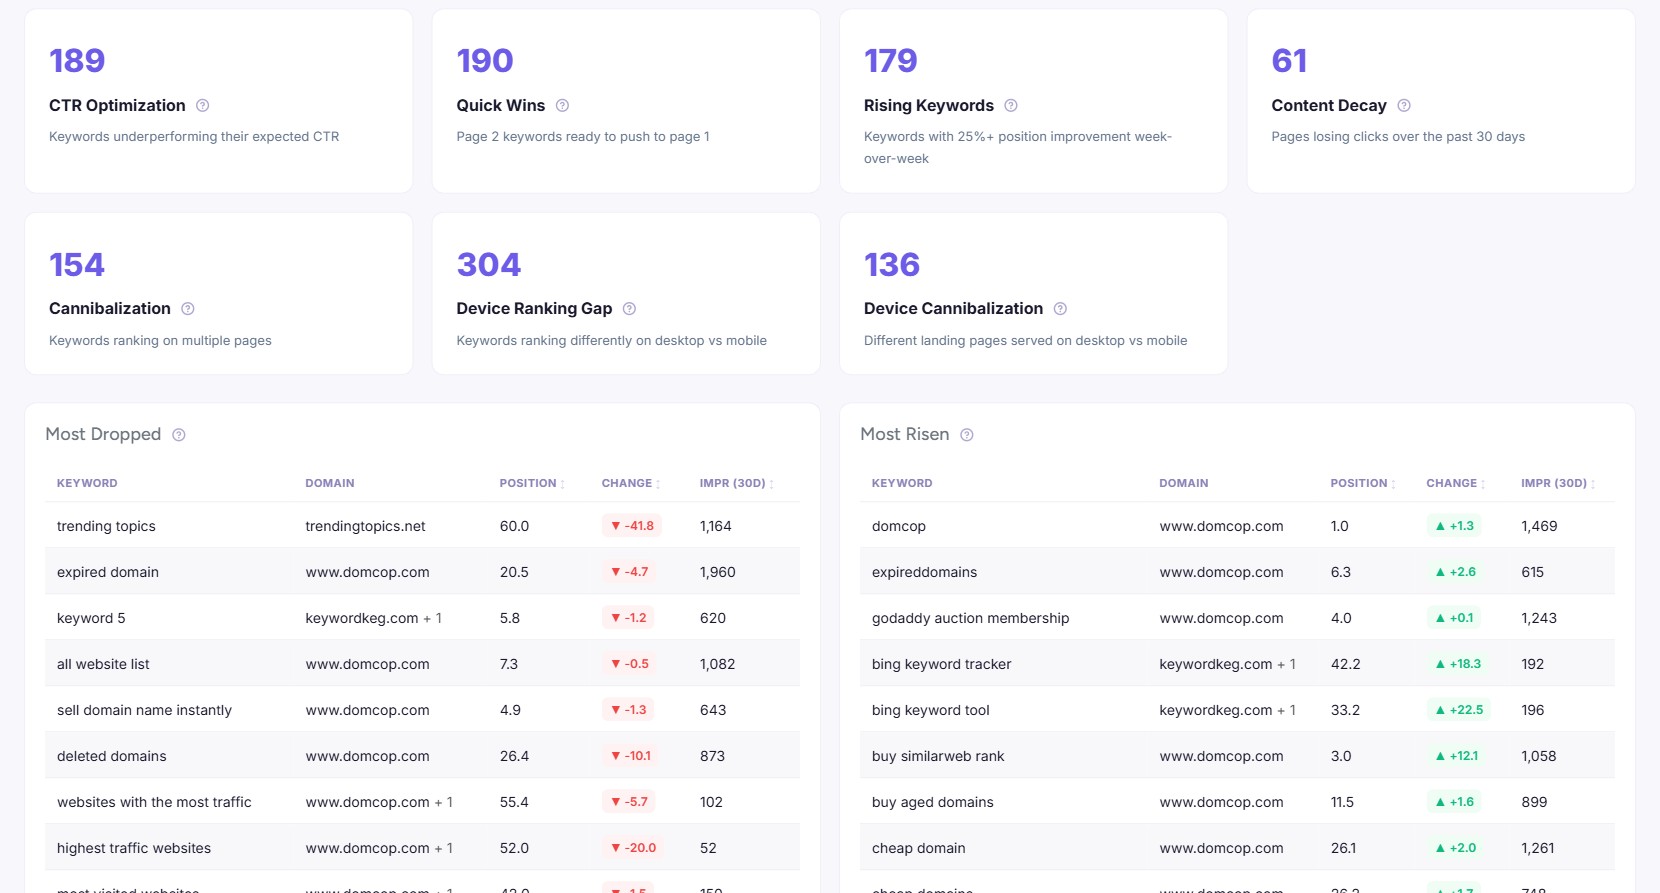
Scroll down and you will see report summary widgets showing how many opportunities each report has found. Click any widget to jump straight to that report.
Below the report widgets, the Most Dropped and Most Risen tables show your biggest ranking movers in the last 24 hours, sorted by importance (not just raw position change). A keyword dropping from position 3 to 6 will appear higher than one dropping from 80 to 90, because the business impact is greater near the top of search results.
3. Tracked Keywords
This is where you spend most of your time. The Tracked Keywords page shows every keyword you have chosen to monitor, with daily position updates, historical trends, and enriched data from Keywords Everywhere.
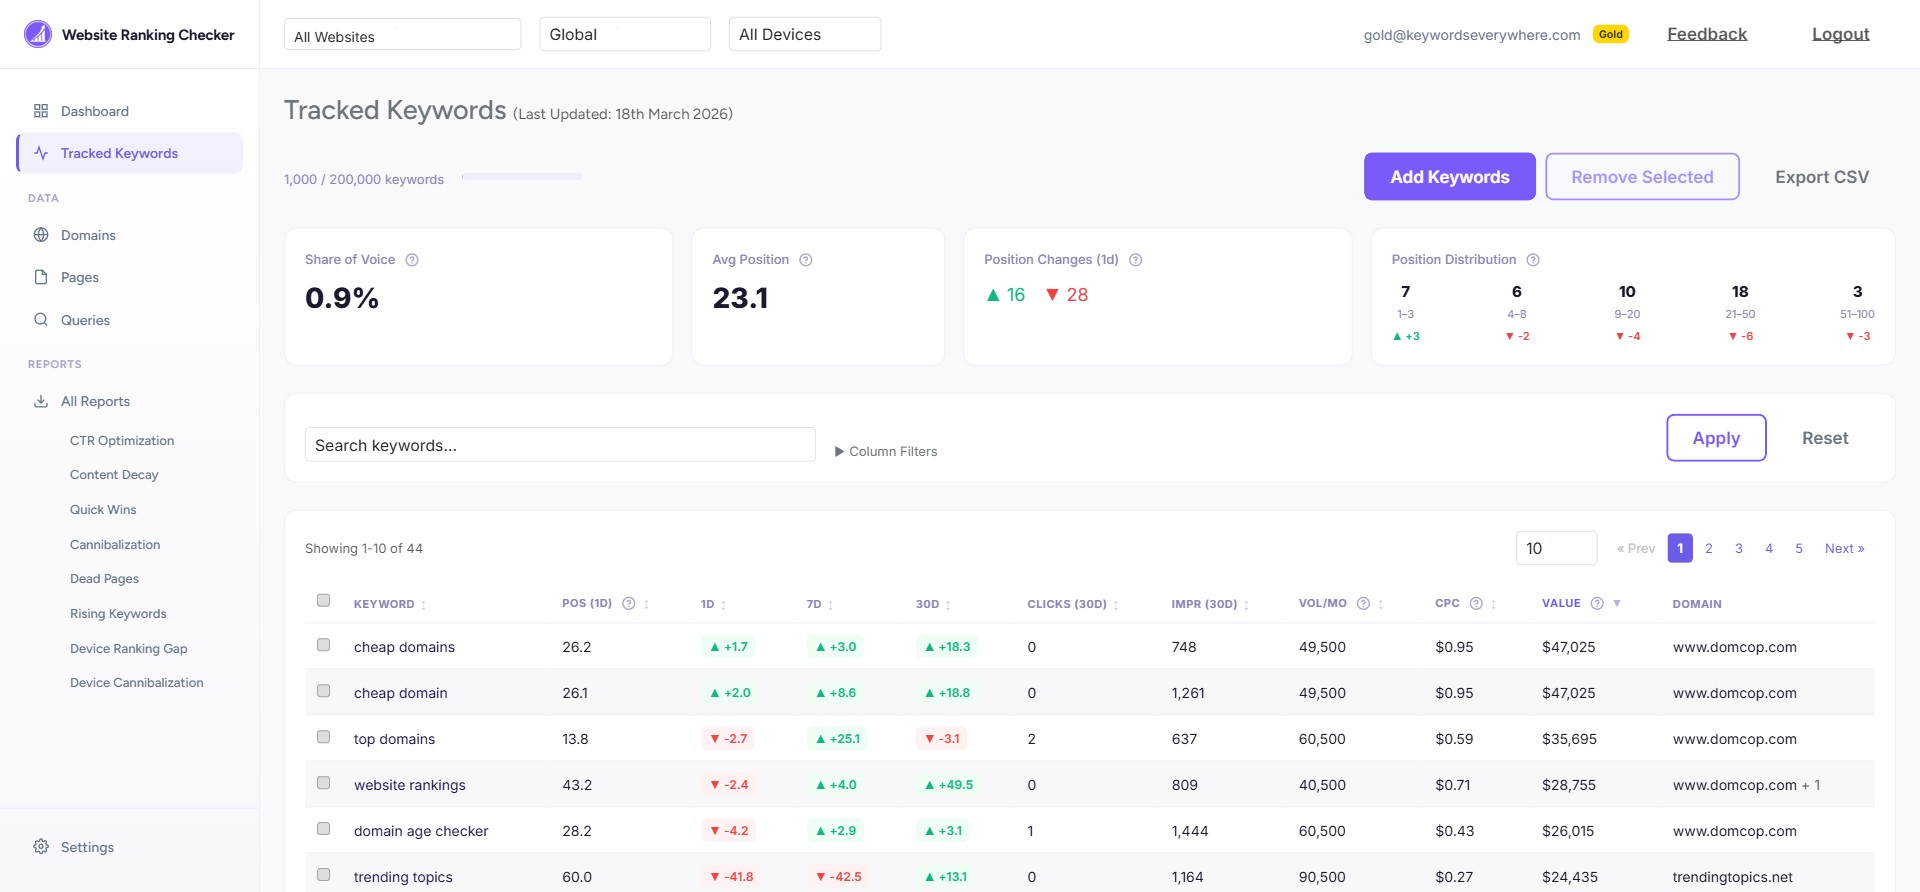
Summary cards
At the top, four cards give you a snapshot:
- Share of Voice - your percentage of total available impressions
- Avg Position - average ranking across tracked keywords
- Position Changes (1d) - how many keywords moved today
- Position Distribution - how your keywords are spread across ranking bands (1-3, 4-8, 9-20, 21-50, 51-100)
The keyword table
Each row in the table shows one tracked keyword with:
- Position - the best ranking across all your domains
- 1D, 7D, 30D - position changes over 1 day, 7 days, and 30 days
- Clicks and Impressions (30d) - search traffic data from the last 30 days
- Vol/Mo - monthly search volume from Keywords Everywhere
- CPC - cost per click in Google Ads (a proxy for commercial value)
- Value - estimated dollar value of your organic traffic (clicks x CPC)
- Domain - which of your sites ranks for this keyword
Click any keyword row to see its position history chart, showing exactly how the ranking has moved over time.
Adding keywords
Click the purple Add Keywords button to type in keywords manually. Or, go to the Search Queries page and click "Track" next to any query you want to monitor. The second approach is usually better because you are picking from keywords Google already associates with your site.
Sorting and filtering
Click any column header to sort. Use the search box to find specific keywords. Click "Column Filters" to filter by position range, volume, CPC, or other metrics.
4. Search Queries
The Queries page shows every search term that triggered your site in Google results over the last 30 days. This is your complete keyword footprint, pulled directly from Google Search Console.
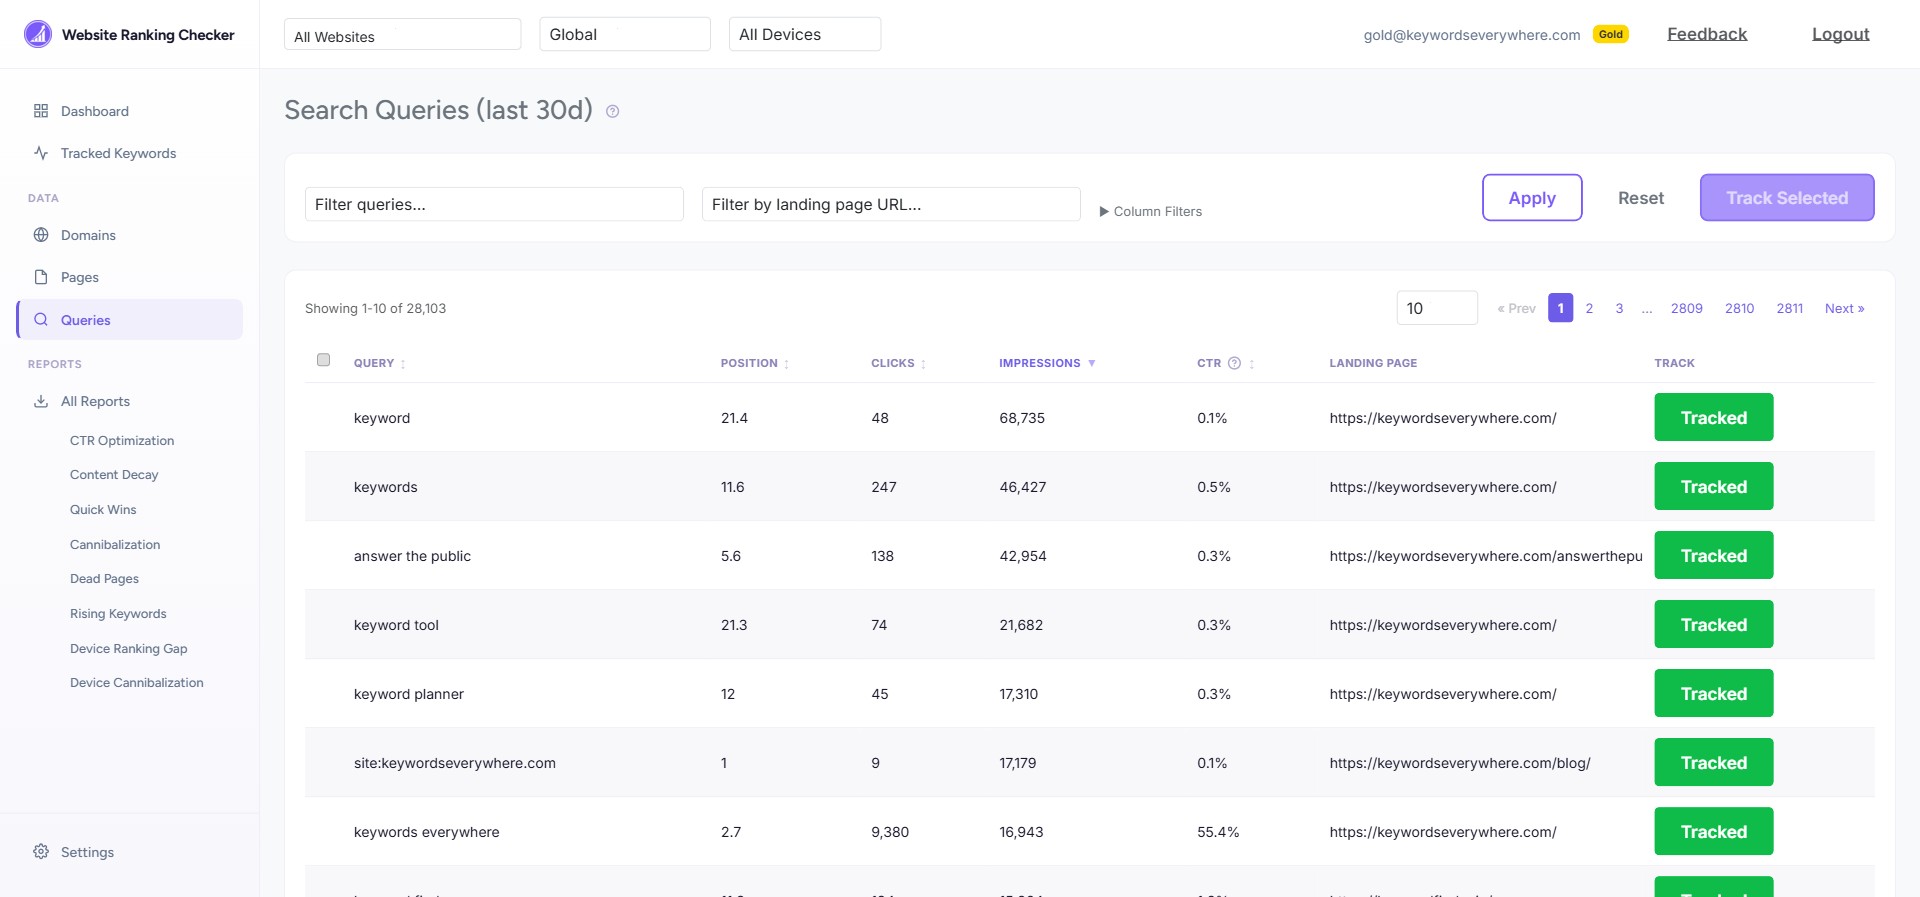
Think of this page as your keyword discovery tool. You will find queries here that you did not know your site was ranking for. Some will be worth tracking, some will not.
Tracking a keyword
See a query that matters to your business? Click the purple Track button on the right. The keyword will immediately appear on your Tracked Keywords page and start getting daily position snapshots, Keywords Everywhere metrics, and alert monitoring.
Keywords you are already tracking show a green Tracked badge instead.
What to look for
- High impressions, few clicks: You are showing up in search but people are not clicking. Your title or meta description might need work.
- Good position, low CTR: If you are in the top 5 but CTR is below 2%, your search snippet might not be compelling enough.
- Surprising queries: Look for queries you did not expect. They can reveal content opportunities you had not considered.
5. Pages
The Pages view shows every URL on your site that appeared in Google search results, sorted by clicks. This is the same data you would see in Google Search Console, but easier to filter and explore.
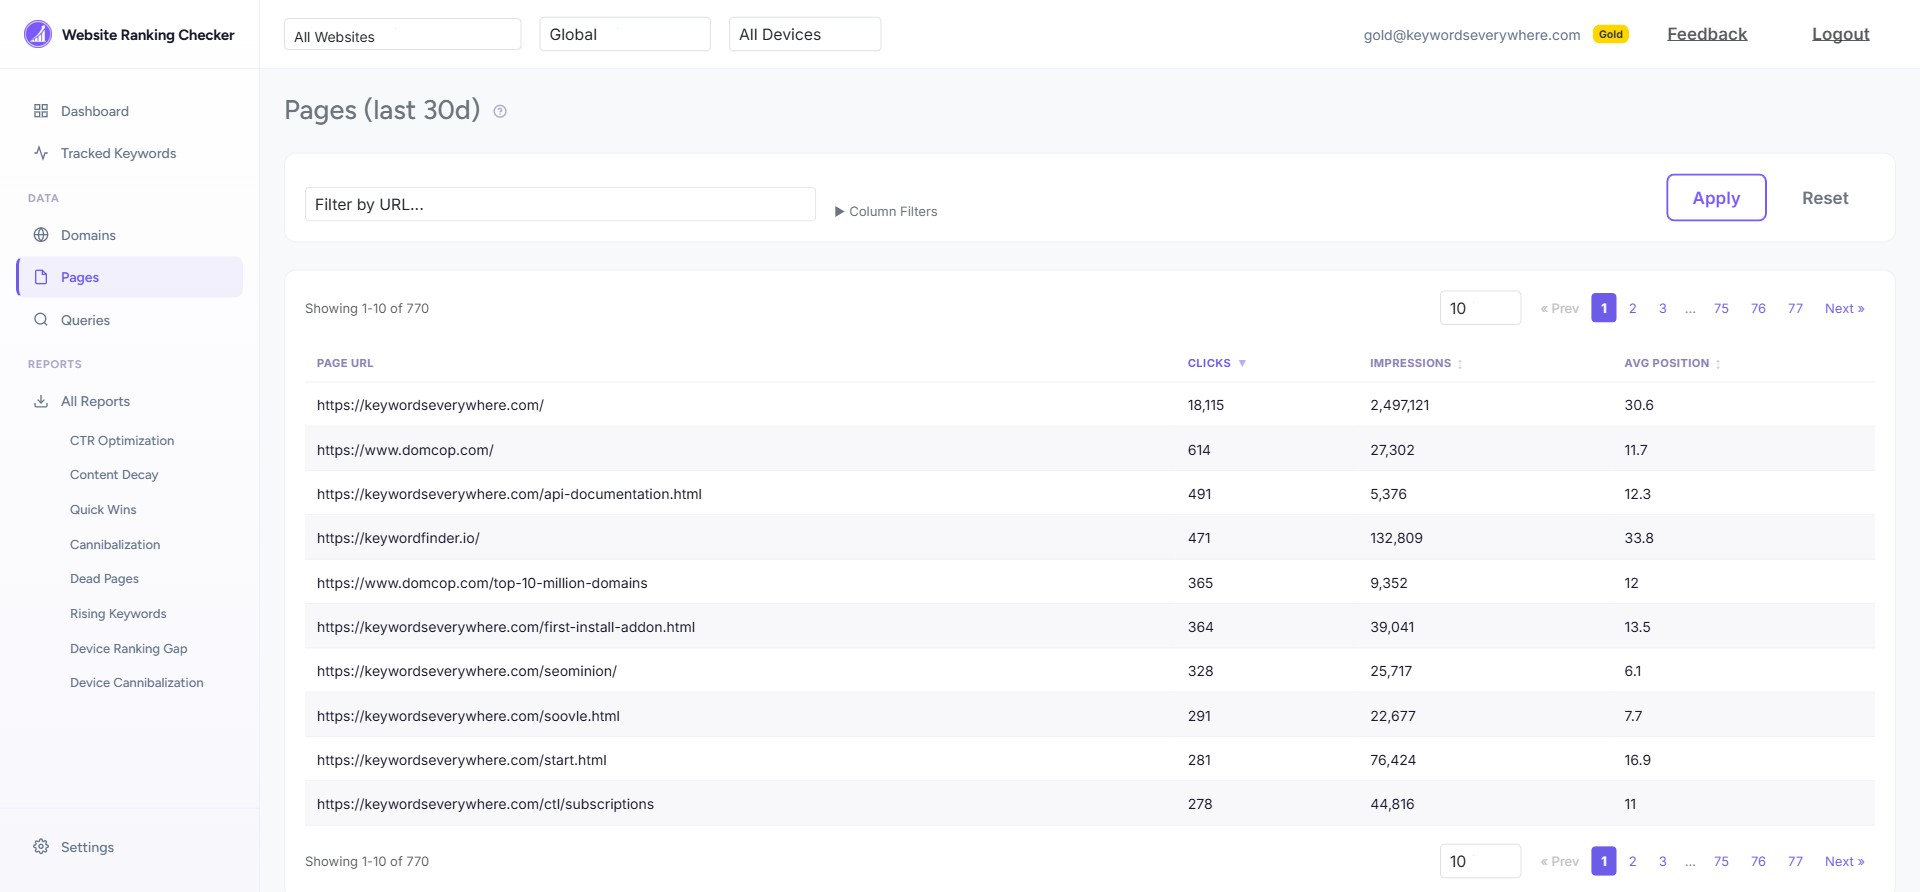
Use this page to answer questions like:
- Which pages are getting the most search traffic?
- Are there pages with high impressions but low clicks?
- Which pages have the best average position?
6. Domains
The Domains page shows all the websites from your Google Search Console account. Each domain appears as a card with a summary of its keywords, clicks, impressions, and average position.
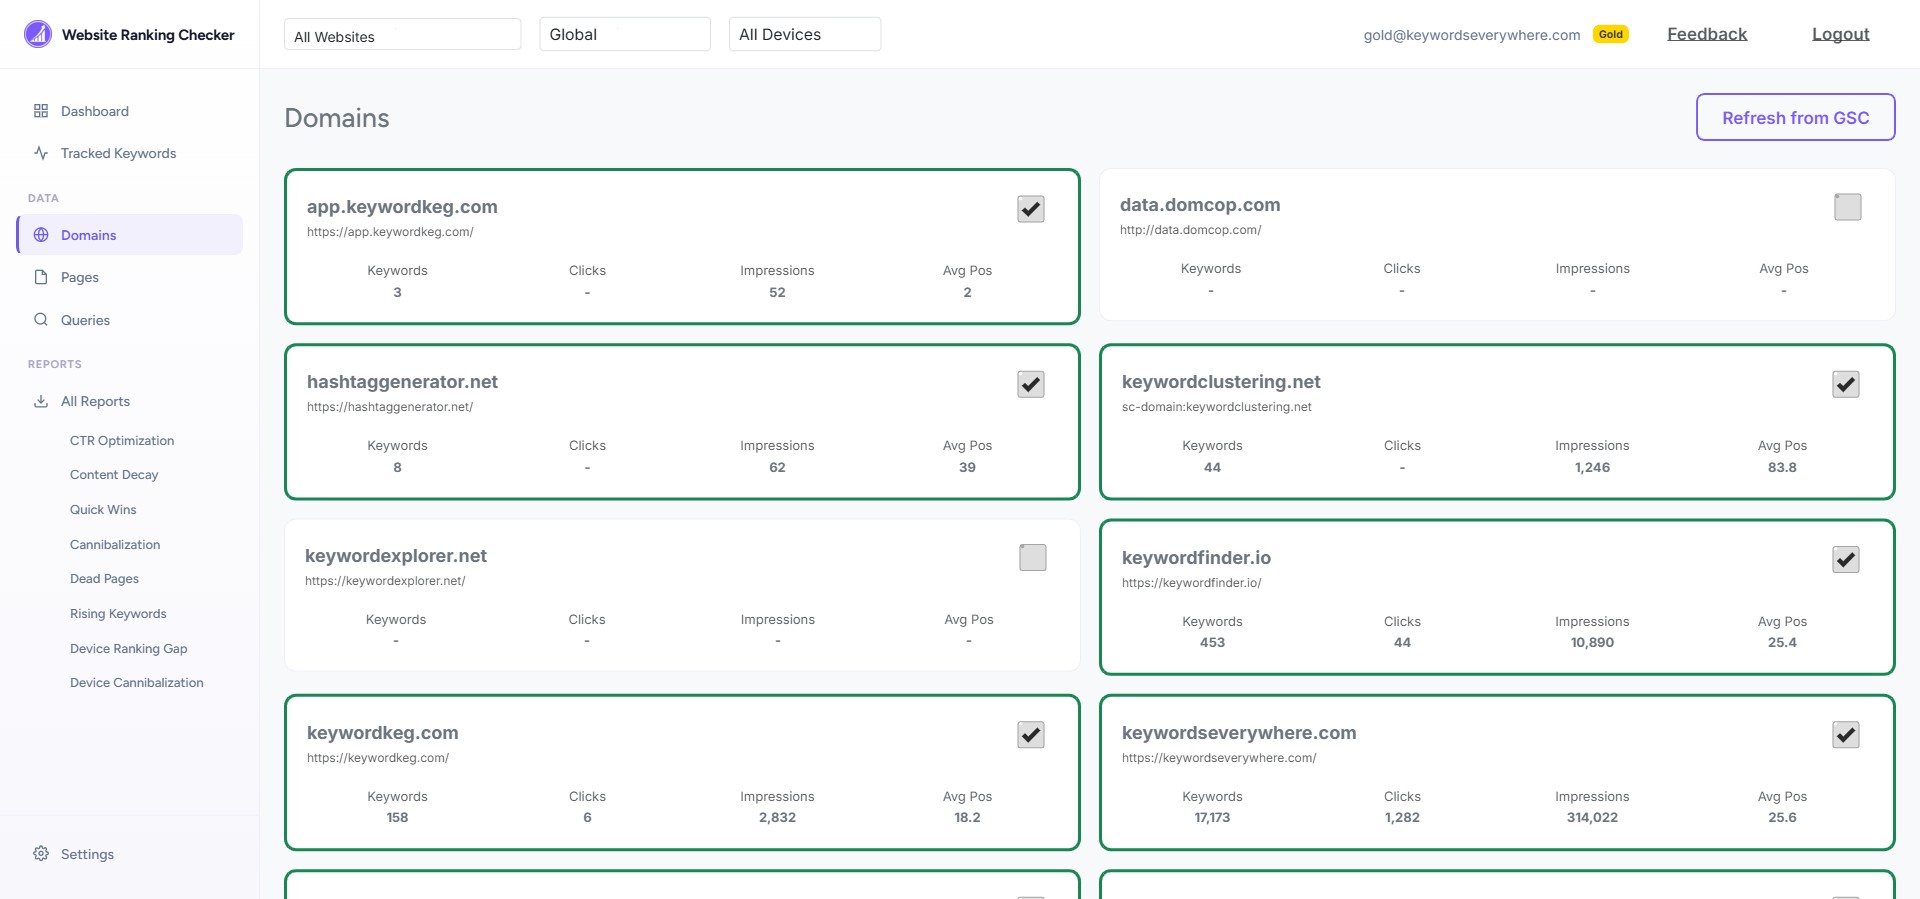
Enabling and disabling domains
Each domain has a toggle switch. When a domain is enabled (green), we fetch its search data daily. When disabled (grey), we stop fetching new data but keep the historical data you already have.
If you manage multiple websites, you can disable the ones you do not need right now to keep your dashboard focused.
Filtering by domain
Use the "All Websites" dropdown in the top navigation bar to filter the entire app to a single domain. This affects the Dashboard, Tracked Keywords, Queries, Pages, and all reports.
7. SEO Reports
Website Ranking Checker generates 8 opportunity reports automatically every day. Each report analyzes your search data from a different angle and surfaces specific things you can act on.
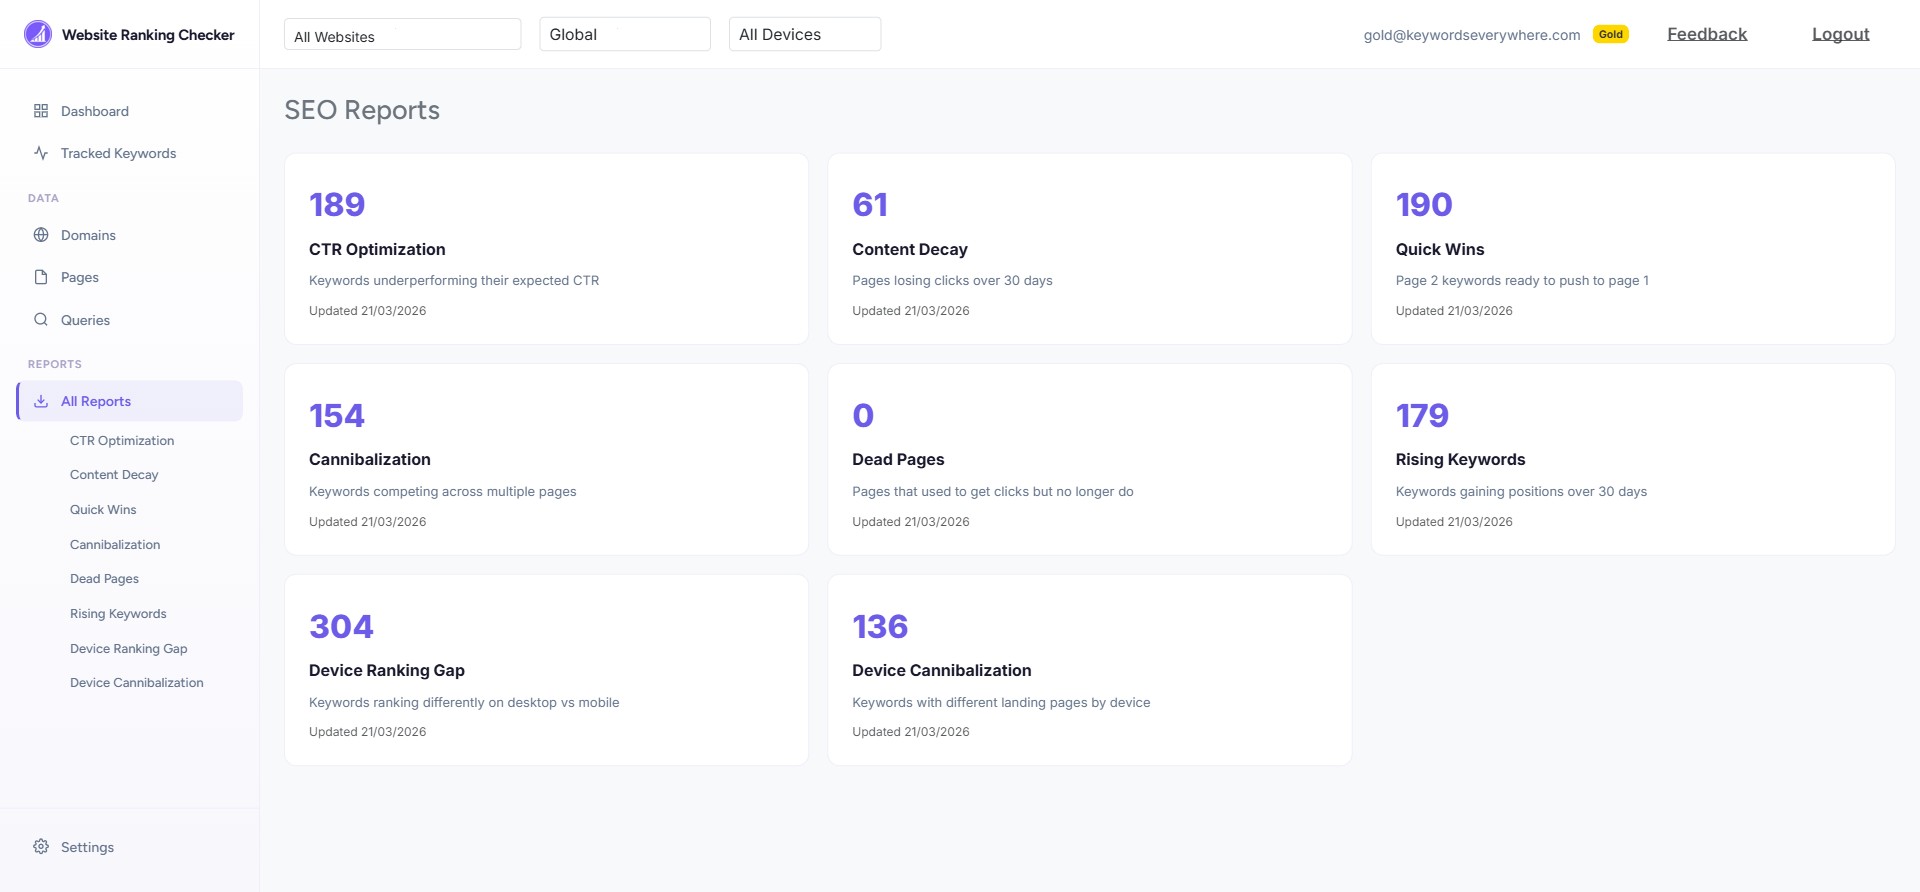
The reports summary page shows all 8 reports with the number of opportunities found in each. Click any card to see the full report.
The 8 reports
| Report | What it finds | What to do |
|---|---|---|
| CTR Optimization | Keywords in the top 10 where your click-through rate is below what is expected for that position | Improve your title tags and meta descriptions to get more clicks from the same rankings |
| Content Decay | Pages losing clicks compared to 30 days ago | Update the content, check for new competitors, or add fresh information |
| Quick Wins | Keywords ranked 11-15 with high impressions | These are closest to page 1. A small push (better content, a few links) could get them there |
| Cannibalization | Keywords where multiple pages on your site compete against each other | Consolidate content or use canonical tags to tell Google which page should rank |
| Dead Pages | Pages with zero clicks now but that used to get search traffic | Decide whether to update, redirect, or remove these pages |
| Rising Keywords | Keywords gaining 25%+ position improvement week-over-week | Double down on what is working. Add more content around these topics |
| Device Ranking Gap | Keywords that rank 3+ positions differently on desktop vs mobile | Check mobile page speed, responsiveness, and Core Web Vitals |
| Device Cannibalization | Keywords where Google shows a different landing page on desktop vs mobile | Ensure your mobile and desktop content is consistent |
Example: Quick Wins report
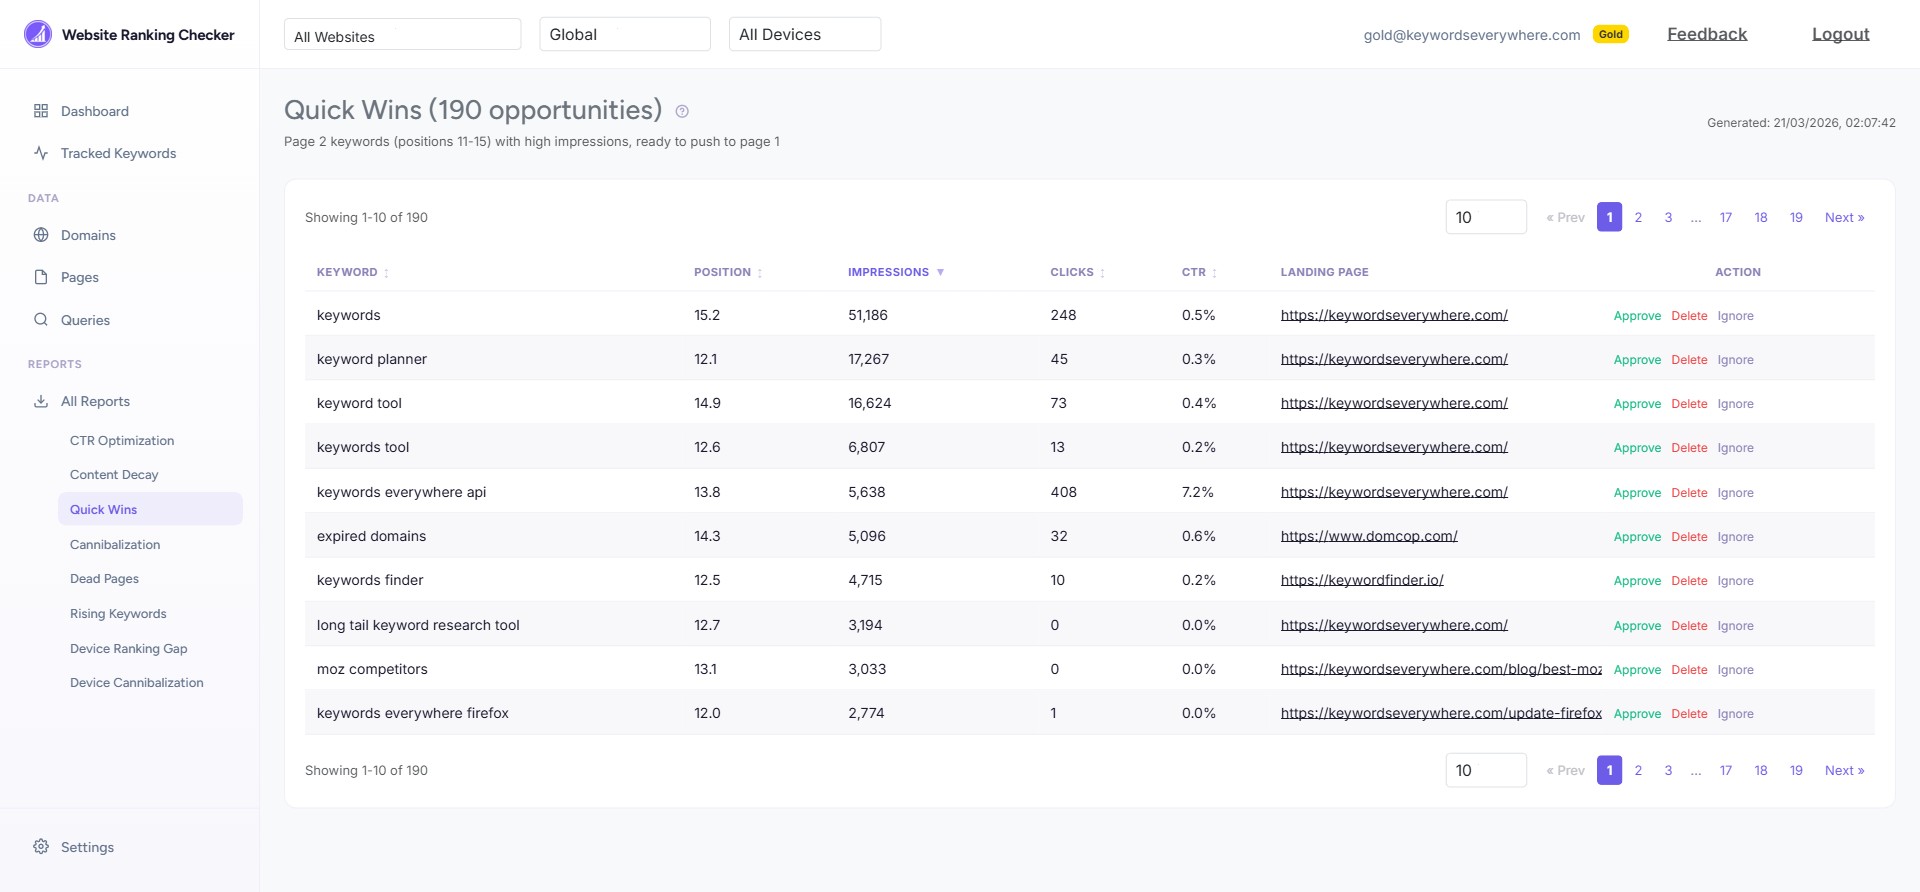
The Quick Wins report is a good place to start. These keywords are ranked just outside page 1 (positions 11-15) and already have significant impressions. They are the closest to a meaningful ranking improvement with the least effort.
8. Settings and Alerts
The Settings page lets you manage your account, Google Search Console connection, notification email, and ranking alert preferences.
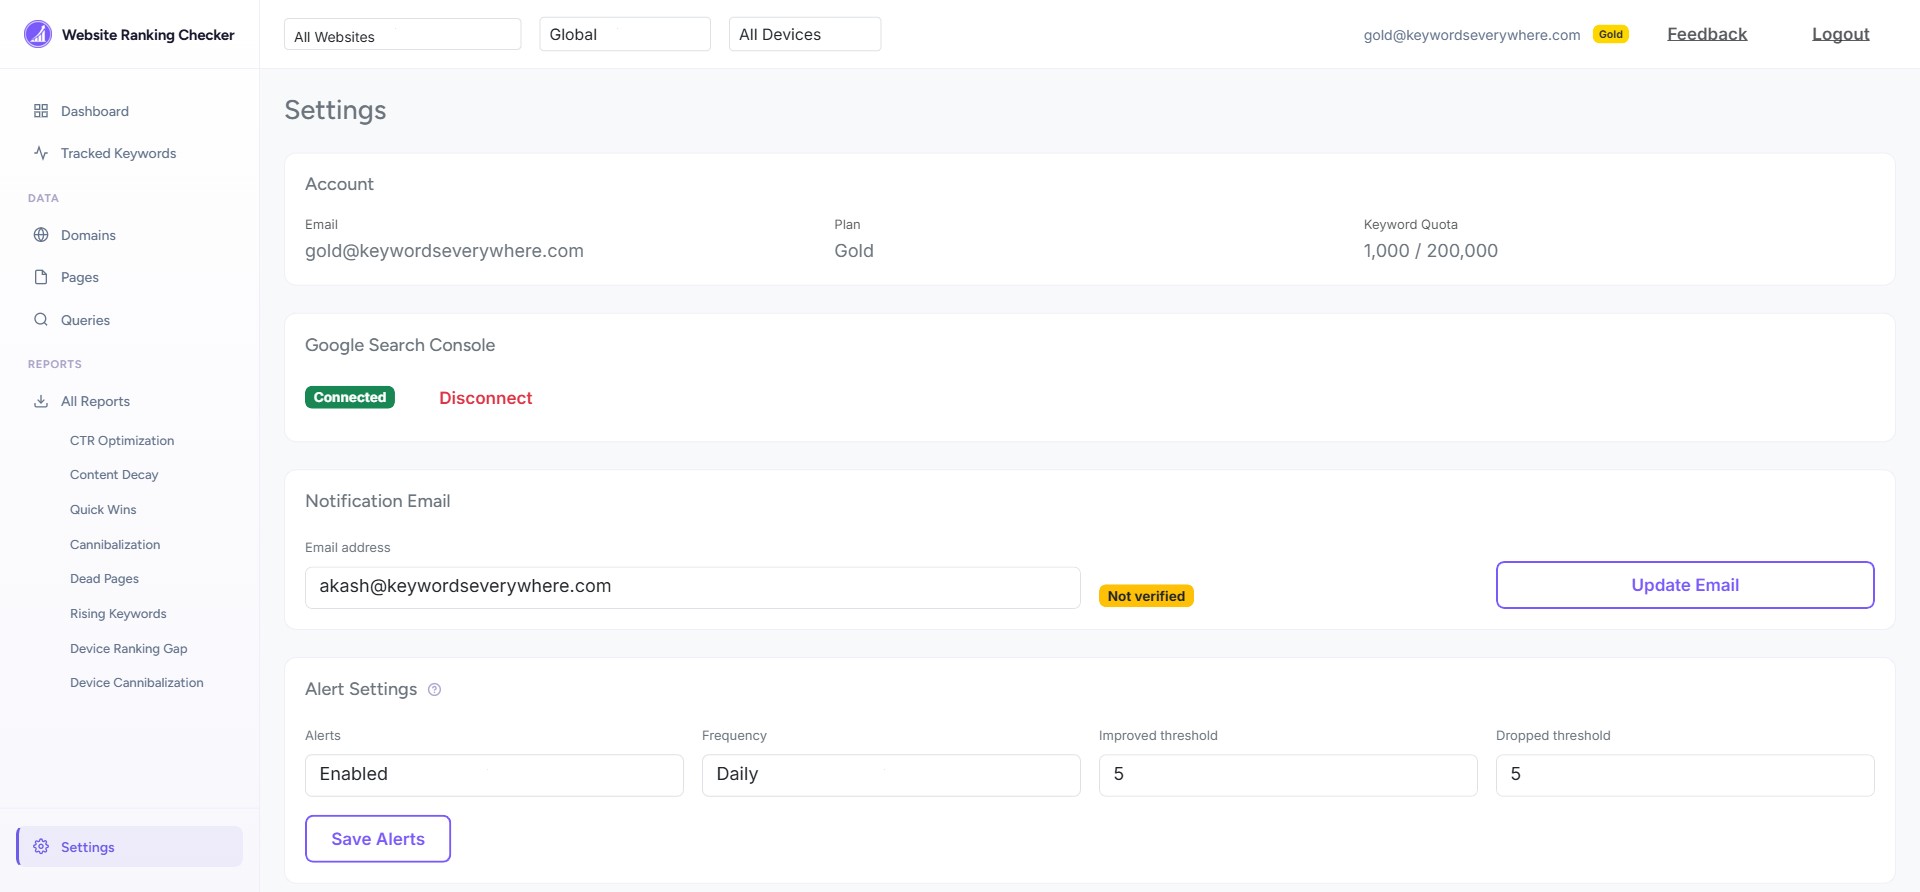
Ranking alerts
When enabled, you will receive email notifications when your tracked keywords have significant position changes. You can choose:
- Frequency: Daily or weekly digests
- Thresholds: How many positions a keyword needs to move before triggering an alert
The system uses smart tiered thresholds so keywords near the top of search results (positions 1-10) trigger alerts with smaller changes than keywords ranked further down. This reduces noise from normal fluctuations in lower positions.
Google Search Console
You can see your connection status and disconnect at any time. Disconnecting immediately deletes your stored OAuth tokens and stops all data fetching.
9. Filters and Navigation
Global filters
The top navigation bar has three dropdown filters that apply across the entire app:
- Website: Filter to a specific domain or view all websites combined
- Country: Switch between Global data and country-specific data (available countries depend on your plan)
- Device: View data for All Devices, Desktop Only, Mobile Only, or Tablet Only
These filters affect every page - the Dashboard, Tracked Keywords, Queries, Pages, and all reports will reflect your selection.
Per-page filters
Most pages have their own search box and "Column Filters" for more specific filtering. For example, on the Tracked Keywords page you can filter by position range, minimum volume, or CPC threshold.
Sorting
Click any column header in a table to sort by that column. Click again to reverse the sort order. A small arrow next to the column name shows the active sort direction.
Pagination
Large result sets are paginated. Use the per-page dropdown (50, 100, 250, or 500 rows) and the page navigation at the top right of each table.
Exporting data
On the Tracked Keywords page, click the Export CSV button to download your keyword data as a spreadsheet. This exports all keywords matching your current filters.
10. Tips for Getting the Most Value
Start with Quick Wins
If you are new and wondering where to focus, open the Quick Wins report first. These are your lowest-effort, highest-impact opportunities. A keyword at position 12 with 5,000 monthly impressions could bring significant traffic if you push it to page 1.
Check the Dashboard daily
Make it a habit to glance at the Dashboard each morning. The Search Score trend line and the Most Dropped table will immediately tell you if anything needs attention.
Track the keywords that matter, not everything
You do not need to track every query your site appears for. Focus on keywords that drive revenue, leads, or meaningful traffic. Quality of tracking beats quantity.
Use the Queries page for discovery
Visit the Queries page regularly to find new keywords Google is starting to associate with your site. These are organic growth signals worth tracking.
Set up alerts
Enable email alerts in Settings so you do not have to check the app every day. The weekly digest is a good starting point. It surfaces important ranking changes without cluttering your inbox.
Filter by domain when you have multiple sites
If you manage multiple websites, use the domain selector in the top bar to focus on one site at a time. The reports and dashboard stats will only show data for that domain.
Review the CTR report monthly
CTR optimization is often overlooked. If you are ranking well but not getting clicks, improving your titles and descriptions can increase traffic without needing to improve rankings.
That covers everything. If you have questions about a specific metric, check the Glossary for detailed explanations of every number you see in the app.