


Two keywords from our own portfolio, same site, same month.
Keyword one ranks at position 3 on page 1. It was shown 6,097 times and earned 96 clicks. That's a 1.57% click-through rate, roughly a sixth of what any CTR study says position 3 should earn.
Keyword two ranks around position 2. It was shown 5,744 times and earned 3,114 clicks. That's 54%, about triple what the studies say position 2 earns.
Same site. Same month. One keyword earning a sixth of "average", one earning triple.
Now, which published CTR curve should I have compared them against? FirstPageSage says position 1 gets 39.8% of clicks. Sistrix measured 28.5%. A widely-shared industry curve says 20.5%. A 2025 study of 200,000 keywords says it fell to about 19% after AI Overviews arrived.
Ask five studies, get five curves, and your own site will match none of them.
This article is about escaping that mess: the expected-CTR curve we actually ship inside our product (published in full below, for the first time), real data from our own sites showing why observed CTR looks nothing like any benchmark, and the per-keyword method that makes CTR data useful anyway.
There's a calculator halfway down if you want to skip straight to "how many clicks should MY keyword be getting."
- Published CTR-by-position studies disagree wildly (position 1 = anywhere from 19% to 40%) because they measure different query mixes in different years. None of them is "the" answer.
- We publish the 13-level expected CTR curve our product uses: position 1 = 25%, position 5 = 3%, position 10 = 0.6%, positions 11-20 = 0.3%. Deliberately conservative, built for opportunity math.
- Your site's observed CTR per position will not match any curve, and ours doesn't either: our position-1 bucket shows 0.76% (one zero-click query poisons it) and our position-2 bucket shows 41% (a brand query).
- The working method is per-keyword: expected CTR at your position, times impressions, versus actual clicks. Keywords under 30% of expected are your fix-list.
Why every CTR study disagrees
The studies aren't wrong. They're measuring different things.
Different query mixes. A dataset heavy in branded queries (where the #1 result gets nearly every click) produces a steep curve. A dataset of informational queries in feature-crowded SERPs produces a flat one. No two studies sample the same mix.
Different years. The SERP of 2020 (ten blue links, some ads) and the SERP of 2026 (AI Overviews, feature boxes, "People also ask" everywhere) hand out clicks very differently. The 200K-keyword study that measured position 1 falling from 28% to 19% isn't contradicting the older studies; it's measuring a different Google.
Averages versus medians, desktop versus mobile, zero-click handling. Every methodological fork moves the curve.
So when a dashboard says a keyword's CTR is "below average", the honest question is: below whose average, measured on what queries, in which year?
That's not a reason to ignore CTR data. It's a reason to stop benchmarking against other people's curves and start benchmarking each keyword against one consistent baseline of your own. Which is what the rest of this article does.
The expected CTR curve we actually use
Our rank tracker needs an expected CTR for every position, because several of its reports and scores multiply position-based expectations against impressions to estimate opportunity: what a ranking is worth, which keyword underperforms, what moving from 12 to 5 would earn.
Here is the full curve it uses, published exactly as it runs in production:
| Position | Expected CTR |
|---|---|
| 1 | 25.0% |
| 2 | 15.0% |
| 3 | 10.0% |
| 4 | 5.0% |
| 5 | 3.0% |
| 6 | 2.0% |
| 7 | 1.5% |
| 8 | 1.0% |
| 9 | 0.8% |
| 10 | 0.6% |
| 11-20 | 0.3% |
| 21-50 | 0.05% |
| 51+ | 0.01% |
Two things about this curve are deliberate.
It's conservative at the top. We use 25% for position 1 when studies claim up to 39.8%. That's on purpose: this curve powers opportunity estimates, and a tool that overpromises clicks ("move to #1 and get 40% CTR!") writes checks your SERP can't cash. When AI Overviews, ads, and feature boxes eat into a query, reality lands closer to the conservative number.
The cliff below position 10 is the point. Position 10 expects 0.6%; positions 11-20 expect 0.3%; positions 21-50 expect 0.05%. The difference between page 1 and page 2 isn't a step, it's a canyon, and it's why pushing a position-12 keyword to position 8 is usually worth more than pushing a position-3 keyword to position 2. That math is the whole engine behind the quick wins approach.
Treat the absolute numbers as a consistent measuring stick, not gospel about your niche. The magic isn't in the values; it's in using the same curve for every keyword so gaps become comparable.
Your CTR won't match any curve (here's real proof)
To show you how badly observed CTR diverges from any curve, here's our own portfolio's data. For one recent 30-day window, we took every keyword with 100+ impressions across our sites, computed each keyword's impression-weighted position, bucketed them by position 1 through 10, and measured each bucket's actual CTR.
Look at position 1: 0.76% observed, against 25% expected. A disaster?
No. One query.
Our position-1 bucket includes a site: query, the kind people type to check indexing, with 16,544 impressions and 9 clicks. Nobody "searching" site:ourdomain.com wants to click a result; the answer is the result list itself. That single zero-click query is 69% of the bucket's impressions, and it drags a healthy bucket down to 0.76%.
Position 2 has the opposite disease: 41% observed against 15% expected, because one navigational brand query (people searching for our product by name) converts 54% of its impressions to clicks. Navigational searchers click through almost every time.
Positions 3 through 10 tell the quieter version of the same story: our observed CTRs sit below the curve at most positions, partly because our niche's SERPs are crowded with tools, snippets, and answer boxes that absorb clicks before they reach anyone organic.
Three lessons from this chart:
- Bucket averages are hostage to query mix. One weird query rewrites a whole position's "average". This is the same reason site-wide average CTR in GSC is nearly meaningless.
- Brand and zero-click queries must be read separately. They're not underperforming or overperforming; they're different animals.
- If our observed curve can't match our own expected curve, yours won't match a published study's. Stop grading your site against benchmarks built on someone else's query mix.
Which raises the obvious question: if averages mislead, how do you actually use any of this?
The method that works: per-keyword CTR gap
Per keyword. Never per site, rarely per bucket.
For each keyword you care about:
- Take its impression-weighted position from Search Console data (not last-seen position; the weighted one, since positions blend and wobble).
- Look up expected CTR at that position from the curve above.
- Expected clicks = impressions × expected CTR.
- Gap = (expected clicks - actual clicks) / expected clicks.
Our worked example, the position-3 keyword from the intro: 6,097 impressions at position ~3 expects 10%, so ~610 clicks. Actual: 96. Gap: 84%.
That keyword converts a sixth of what its position deserves, and that number, the per-keyword gap, is comparable across your whole site in a way no average ever is.
The threshold we use in production: a top-10 keyword whose actual CTR is below 30% of expected goes on the fix-list. Above that line, the difference is usually SERP weather, not a page problem.
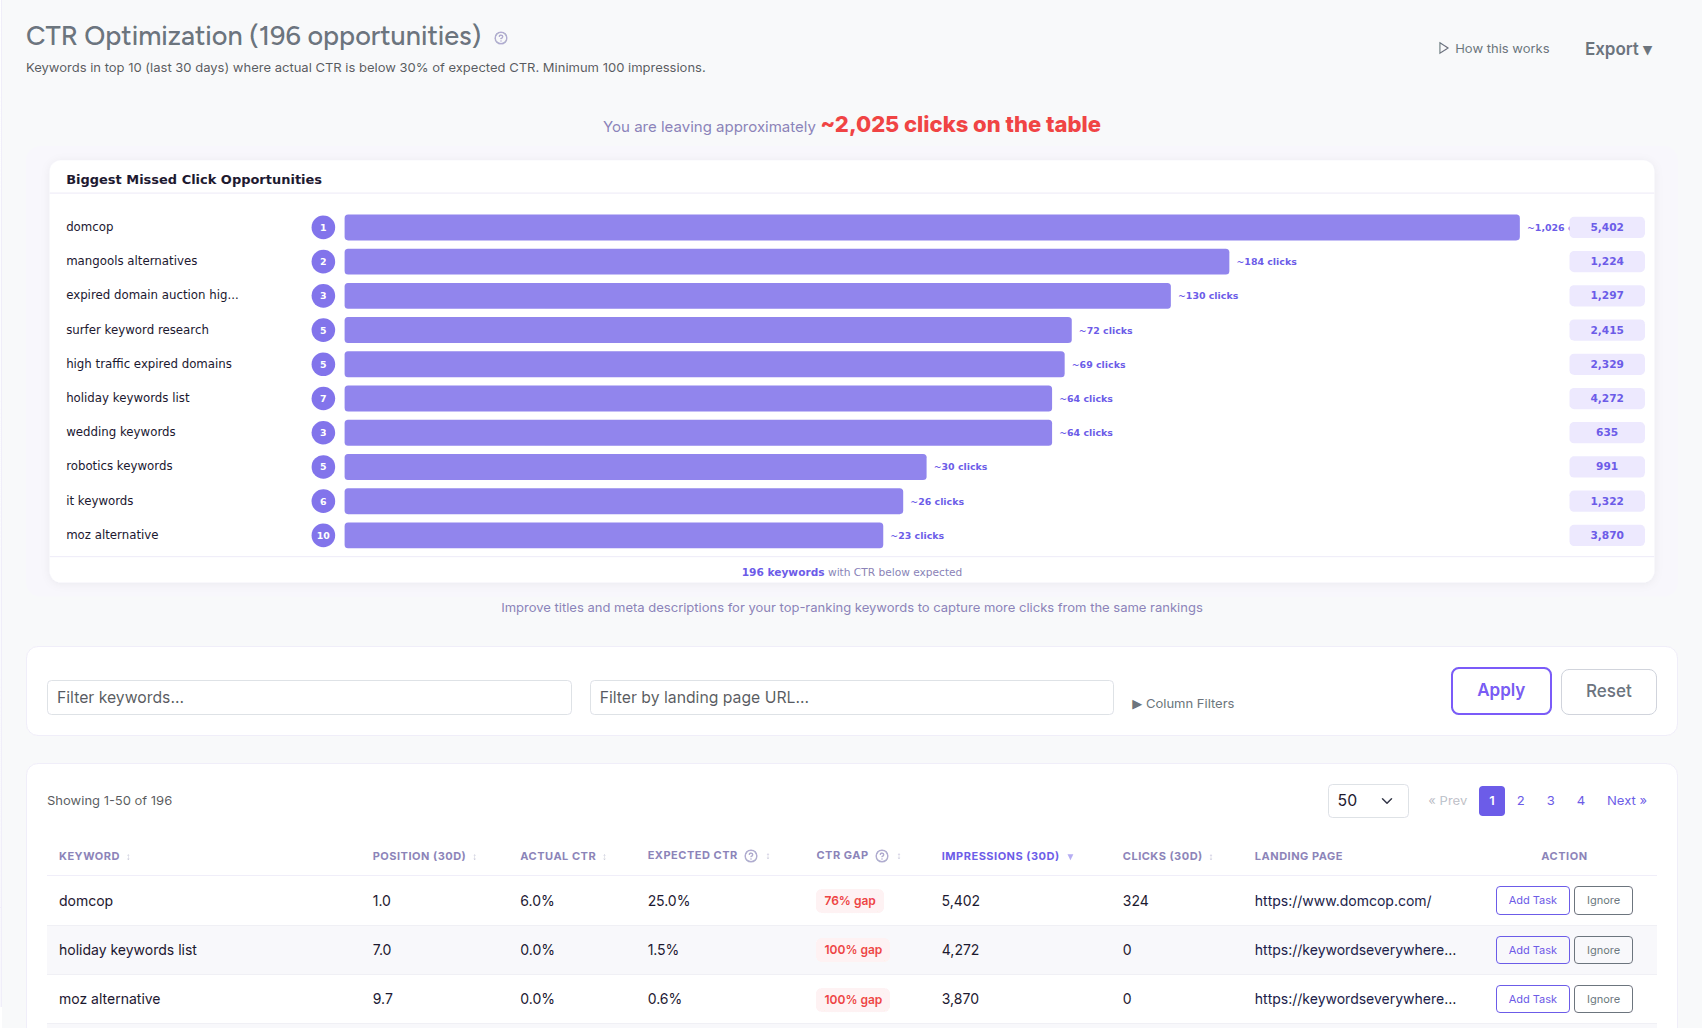
The same per-keyword gap calculation, run daily: weighted position, expected vs actual CTR, and the clicks at stake.
Nobody computes this by hand for 500 keywords. The CTR Optimization report runs this exact calculation daily across every top-10 keyword you track: weighted position, expected versus actual CTR, gap percentage, sorted by what's costing you the most clicks. Free, from your own Search Console data.
Calculator: expected clicks for your keyword
Grab the position and impressions for any keyword from Google Search Console (Performance report, Queries tab), plug them in, and compare.
Fixable vs structural low CTR
A big gap tells you a keyword underperforms its position. It doesn't yet tell you whose fault that is. Before rewriting titles, split the cases:
| What you see | Likely cause | Fixable? |
|---|---|---|
| Big gap, your title is generic or truncated | Weak title/meta | Yes, the classic fix |
| Big gap, SERP shows an AI Overview or featured snippet above you | The SERP answers before you | Partly: win the feature, or target click-worthy variants |
| Big gap on a definitional query ("what is X") | Zero-click intent | Mostly structural; deprioritize |
| Big gap, the ranking URL is your homepage, not the topic page | Wrong page ranking | Yes: internal links, see cannibalization |
| Big gap only on mobile | Title truncates or the SERP differs on mobile | Yes: shorter titles, check the mobile SERP |
| Small gap everywhere | Nothing wrong | Spend your time on positions instead |
| Impressions steady, clicks fell over months | A SERP feature arrived (a decay pattern) | Structural; adjust targets |
The split matters because CTR advice usually pretends everything is case one. In feature-heavy niches, half your gaps are structural, and knowing which half saves you from rewriting titles that were never the problem.
5 tactics that raise CTR without moving position
For the fixable cases, in order of effort:
1. Rewrite the title as the answer to the query, not the topic. "Keyword Cannibalization: Definition and Meaning" loses to "Keyword Cannibalization: How to Find and Fix It (With Examples)". Front-load the query's words, promise the outcome, stay under roughly 60 characters so it doesn't truncate.
2. Write the meta description as ad copy. Google rewrites half of them, but when yours shows, it's your one sentence of sales copy. State the concrete benefit and include the query's phrasing (it gets bolded in the snippet).
3. Win the date war. For queries where freshness matters, a visible recent date in the snippet beats a 2023 date at the same position. Only refresh honestly, with real updates, or you're the person from the content-decay mistakes list.
4. Add schema that earns SERP real estate. FAQ schema, ratings, breadcrumbs: anything that makes your result taller. More pixels, more clicks, same position.
5. Match the snippet to click intent, not just search intent. If the SERP's winning results all say "free", "template", or "2026" in their titles and yours doesn't, you're describing the same content less clickably. Mirror those words when they're true of your page.
Then re-measure the gap after 3-4 weeks. CTR fixes are the fastest feedback loop in SEO, which is why they're the first thing I check in the quick wins playbook.
Common mistakes
Five ways CTR data gets misused.
- Grading your site against a published curve. You now know why: query mix. Grade keywords against one consistent curve instead, and grade them individually.
- Averaging CTR across your whole site. The brand queries and the zero-click queries make site-wide CTR a vanity number in both directions.
- Fixing titles on structural gaps. If an AI Overview answers the query above you, the twentieth title rewrite won't help. Diagnose first.
- Ignoring impressions when judging CTR. 1 click from 8 impressions is 12.5% CTR and statistically meaningless. Demand a few hundred impressions before trusting a gap.
- Optimizing CTR on position 40. Below page 2, expected CTR is nearly zero; there's nothing to optimize. Move the position first, then fix the click-through.
FAQ
- What is the average CTR by position in Google?
- There is no single answer: major studies put position 1 anywhere between 19% and 40%, because they measure different query mixes in different years. As a consistent working baseline, our product uses 25% for position 1, 15% for position 2, 10% for position 3, declining to 0.6% at position 10 and 0.3% for positions 11-20.
- What is a good CTR for position 1?
- For a non-branded informational query in a feature-crowded SERP, 15-25% is healthy. For a branded navigational query, 50%+ is normal (our own brand query converts 54%). For queries answered directly on the SERP, position 1 can legitimately earn under 1%. Judge each keyword against its own expected value, not one universal number.
- Why is my CTR lower than the published averages?
- Usually query mix and SERP features rather than anything broken: zero-click queries, AI Overviews and snippets absorbing clicks, or the published average simply measuring a different kind of query set. Compute the per-keyword gap (expected clicks at your position versus actual); only keywords far under expectation, we use below 30% of expected, deserve fixing.
- How do I calculate expected CTR for my keywords?
- Take the keyword's impression-weighted average position and impressions from Google Search Console, look up the expected CTR for that position on a consistent curve, and multiply by impressions to get expected clicks. Compare with actual clicks: (expected minus actual) divided by expected is your CTR gap. The calculator in this article does it for you.
- Do AI Overviews reduce organic CTR?
- Yes, on the queries where they appear. A 2025 study of 200,000 keywords measured position 1's average CTR falling by roughly a third as AI Overviews scaled. The effect is query-dependent: definitional and quick-answer queries lose the most clicks, while transactional and navigational queries are less affected.
- How can I improve CTR without improving my position?
- Rewrite the title to front-load the query and promise the outcome, treat the meta description as ad copy, keep visible dates honestly fresh, add schema (FAQ, ratings, breadcrumbs) to earn a taller result, and mirror the click-winning words the SERP rewards (like "free" or the current year) when they're true of your content.
Find the keywords earning less than their position deserves
The CTR Optimization report applies the exact curve from this article to every top-10 keyword you track, computes each one's expected-versus-actual gap from your own Search Console data, and sorts by clicks lost. The fix-list writes itself, daily, free.
See your CTR gaps