

Share of Voice in SEO: What It Actually Measures (and the Exact Formula We Use)

Ask three SEO tools for your "share of voice" and you'll get three numbers that don't agree, computed three ways, none of which the vendors fully explain.
That bothers me, because SOV is genuinely the right idea: one number for "how much of the available search attention do we capture," the metric you actually want on a slide.
When we built the SOV chart into our own tool, we had to pick a formula. And since I've already published our expected CTR curve and the reasoning behind it, I'm going to do the same thing here: publish the exact share of voice formula we run in production, the worked math, the normalization trick that makes it readable, and the honest list of ways it can mislead you.
If you only came for the formula, here it is:
Share of Voice = (SUM(volume × expectedCTR(position)) / SUM(volume)) × 400
By the end of this article you'll know exactly why each piece is there, and you'll be able to compute it yourself in a spreadsheet.
- "Share of voice" means at least three different things across SEO tools: impression share, click share, and position-weighted visibility. Ours is the third kind: a volume-weighted expected-click share.
- The formula: SUM(volume × expectedCTR(position)) / SUM(volume), scaled by 400 so that ranking #1 for every tracked keyword reads exactly 100%.
- Worked example inside: three keywords, SOV of 26.4%, and how one keyword moving from position 12 to 5 lifts it to 32.6%.
- SOV measures your tracked list, not the universe: changing the list changes the number. Keep the list stable and brand-aware or the trend lies.
The three things tools call "share of voice"
First, disambiguation, because the term is overloaded.
In advertising, share of voice classically means your slice of total ad spend or media presence in your category. Not our topic.
In SEO, tools use "SOV" for at least three different measurements:
Impression share. Of all the impressions available across a keyword set, how many did you get? Simple, but it treats a position-50 impression (which nobody sees) the same as a position-2 impression.
Click share. Of all clicks available, how many did you capture? Closest to revenue, but only measurable where you already get clicks, and hostage to SERP-feature weather.
Position-weighted visibility. For each keyword: how visible are you, given your position and how many people search for it? Sum that up, weighted by demand. This is what most rank trackers' "visibility" metrics are, each with a proprietary weighting curve they don't publish.
Ours is the third kind, and the weighting curve is the same expected CTR curve I published in the CTR by position article. No secrets anywhere in the pipeline.
The formula we use
For every tracked keyword that qualifies (qualification rules below):
SOV = (SUM(volume × expectedCTR(position)) / SUM(volume)) × 400
Piece by piece:
- volume is the keyword's monthly search volume (from Keywords Everywhere data, in our case). It's the demand weight: a position-3 ranking on a 10,000-volume keyword should count far more than position 3 on a 50-volume keyword.
- expectedCTR(position) is the expected click-through rate at your current position, from the 13-level curve. It converts "where you rank" into "how much of the demand you can expect to capture."
- volume × expectedCTR is therefore your expected clicks from that keyword. The numerator sums your expected clicks across the whole tracked set.
- Dividing by SUM(volume) turns it into a share: expected clicks per unit of demand.
- ×400 normalizes the scale, which deserves its own section.
In words: SOV is the share of available search demand you'd expect to convert into clicks, given where you rank today, normalized so that perfection reads 100.
A worked example with real math
Three tracked keywords:
| Keyword | Volume | Position | Expected CTR | Volume × CTR |
|---|---|---|---|---|
| A | 1,000 | 3 | 10% | 100 |
| B | 500 | 1 | 25% | 125 |
| C | 2,000 | 12 | 0.3% | 6 |
Numerator: 100 + 125 + 6 = 231 expected clicks. Denominator: 3,500 total volume.
231 / 3,500 = 0.066. Times 400 = SOV 26.4%.
Read the table again and notice where the number comes from. Keyword C has the most demand (2,000 volume) and contributes almost nothing (6), because page 2 is functionally invisible. Keyword B, with a quarter of C's volume, contributes 20 times more, because position 1.
That's SOV doing its job: it weights your positions by what they're actually worth.
Now move keyword C from position 12 to position 5 (expected CTR 3%): its contribution jumps from 6 to 60. New numerator 285, new SOV 32.6%. One quick-win promotion, six points of share. This is why page-2 keywords with real volume are the highest-leverage moves on the board, and why SOV makes their value visible in advance.
Why ×400: the normalization
The raw ratio (expected clicks per unit of volume) maxes out at 0.25, because the best you can do is position 1 on everything, and position 1's expected CTR is 25%.
A metric that maxes out at 0.25 is miserable to present. So we scale by 400, which makes the theoretical maximum exactly 100:
- Position 1 on every tracked keyword: 0.25 × 400 = SOV 100%
- Position 3 on everything: 0.10 × 400 = 40%
- Position 10 on everything: 0.006 × 400 = 2.4%
So read SOV as: percent of the perfect outcome. An SOV of 26% means you're capturing about a quarter of the expected clicks you'd get if you held #1 for every keyword you track.
That also calibrates expectations honestly: real portfolios don't live near 100. Moving from 8 to 14 is a big quarter. The number is strict because page 1's cliff is strict.
The eligibility guards
Two rules decide whether a keyword counts toward SOV at all, and both exist to keep the number honest.
The keyword needs volume data. No volume, no demand weight, no way to include it without making something up. Keywords without metrics are excluded rather than guessed.
The keyword must appear consistently: on at least 50% of the days in the last 30. Low-volume queries flicker in and out of Search Console below its impression threshold. Without a frequency guard, a keyword that reports only on its three best days would enter the average at its best positions, inflate SOV, then vanish, and your chart would wobble with reporting artifacts instead of rankings. Requiring presence on half the days means the keyword's position data is real enough to weight.
If you compute your own SOV in a spreadsheet, steal both guards. They matter more than the curve choice.
What moves SOV, and what it's for
Because volume weights everything, SOV is dominated by your positions on your highest-volume tracked keywords. A 3-position move on your biggest keyword outweighs ten small keywords improving.
That makes SOV the right metric for exactly one job: the portfolio-level trend. It's the line that tells a founder or client "our overall search presence grew this quarter" without hand-waving, and the line that drops when something structural goes wrong.
It's the wrong metric for diagnosing anything. When SOV moves, you go read the movers and the triage to find out which keywords did it.
The pairing that works: SOV as the headline, average position and per-keyword history as the explanation. (We also compute a value-weighted cousin called Search Score that weights by CPC instead of raw volume; that one gets its own article soon.)
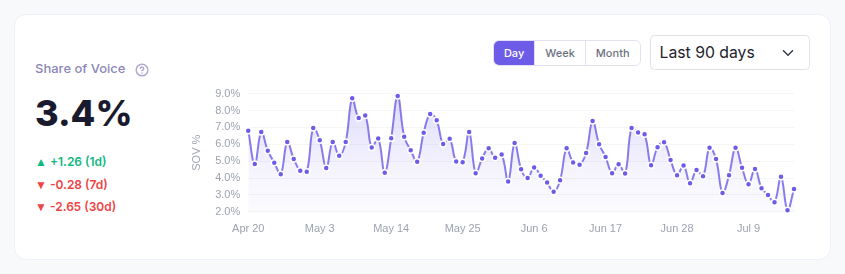
The formula from this article, computed daily. The trend is the product; the math above is the documentation.
Rather not build the spreadsheet? Website Ranking Checker computes this exact formula daily from your Search Console positions and your Keywords Everywhere volumes, with the eligibility guards built in. Free for KE users.
When SOV misleads
Published formula, honest failure modes.
It measures your tracked list, not the market. Add 50 keywords you rank badly for, SOV falls; prune them, SOV rises; nothing real changed. Keep the tracked list stable, and treat every deliberate list change as a chart annotation. (How to curate the list.)
Brand keywords inflate it. Your brand terms sit at position 1 with real volume, contributing maximum weight for rankings you'd keep in your sleep. If you want SOV to measure competitive performance, compute it on non-branded keywords, or at least know what share of your SOV is brand.
Stale or wrong volumes skew the weights. Volumes are monthly estimates; a keyword that seasonally spikes will be over- or under-weighted between refreshes. Directionally fine, decimal-precision not.
Cross-tool comparisons are meaningless. Every tool's visibility metric uses a different curve and different eligibility rules. Compare your SOV to your own history, never to a number from a different formula.
Common mistakes
Five ways SOV gets misused.
- Comparing SOV across tools. Different formulas, different lists, different curves. Only your own trend means anything.
- Churning the tracked list and trusting the chart. Every add and remove moves SOV mechanically. Batch list changes and annotate them.
- Reading SOV daily. It inherits position noise from every keyword in the set. Weekly reads, monthly judgments.
- Ignoring the brand share. A rising SOV that's 70% brand terms is measuring your brand's growth, not your SEO.
- Using SOV to pick what to fix. It's an outcome metric. Fix-lists come from quick wins, decay, and CTR gaps; SOV just tells you whether the portfolio's winning.
FAQ
- What is share of voice in SEO?
- Share of voice measures how much of the available search attention your site captures across a set of keywords. In its most useful form it's position-weighted: each keyword's monthly volume multiplied by the expected click-through rate at your current position, summed and divided by total volume, so high rankings on high-demand keywords dominate the number.
- How do you calculate share of voice?
- Our production formula: SOV = (SUM(volume x expectedCTR(position)) / SUM(volume)) x 400. For each tracked keyword, multiply its monthly search volume by the expected CTR for your current position (25% at #1 down to 0.3% on page 2), sum across keywords, divide by total volume, and scale by 400 so that ranking #1 everywhere equals 100%.
- What is a good share of voice?
- On this formula's scale, holding #1 for everything is 100%, so real portfolios read low: single digits to low tens are common. The absolute number matters less than the trend on a stable keyword list; a move from 8% to 14% over a quarter is substantial growth.
- Why did my share of voice drop?
- Either positions genuinely fell on high-volume keywords (check the biggest-volume keywords first, since they dominate the weighting), or the tracked list changed, or volume data refreshed. If SOV moved and no one edited the list, diagnose it like any ranking drop: movers first, then per-keyword history.
- Is share of voice the same as impression share?
- No. Impression share counts raw impressions regardless of position, so a page-5 impression counts like a page-1 impression. Position-weighted SOV converts each position into expected clicks first, which is why it tracks business reality more closely.
- Can I calculate share of voice for free?
- Yes: export your keywords, positions, and volumes into a spreadsheet and apply the formula above (the expected CTR curve is published in our CTR article). Or connect Search Console to Website Ranking Checker and the SOV chart computes daily, using this exact formula, free.
Watch your share of voice computed daily
Website Ranking Checker computes this exact SOV formula every day for your tracked keywords, from your own Search Console positions and the Keywords Everywhere volumes you already have. The chart on the Keywords page, with this article as the documentation. Free for KE users.
See your SOV